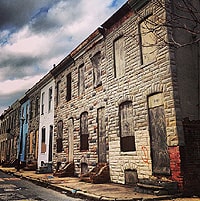
Based in the last two years, January has provided a fairly accurate model for the following 11 months in aggregate. It is never the most deadly month but is never at the bottom of the list
26 kills in 31 Days break down likes so:
Distribution: killings in all 9 precincts, weighted just west of the municipal center
Method: 23 shootings, 1 stabbing, 1 asphyxation, 1 unknown
Gender: 23 male, 3 female
Race: 16 black, 0 white, 0 Asian, 0 Hispanic, 10 race unknown
Lighting: 9 Day, 5 dusk [*5-7 p.m.], 12 night
I am predicting 320 kills over the course of 2018, as urban flight and criminal resettlement continue to export violent crime into the surrounding municipalities.
*Low lighting, combined with high prey count make this the deadliest time of day.
link › jameslafond.blogspot.com
The Logic of Steel Paperback
E-Book